Custom Reports
What is a Custom Report on Amalia?
In Amalia, you have the possibility to create a report on anything that is considered as an output of the calculation engine, for instance payments, statement data, ..., as well as your directory (and we should add more data sources in the near future, such as overwrites, quota values...).
Once you've created your report, you will be able to:
- Preview it, navigate through the different pages, search using the search bar...
- Share it with others
- Generate an Excel document out of it, which means the possibilities are endless:
- Configure the columns to match Payfit format, upload it on Payfit, profit
- Rework the data on your computer, and aggregate multiple sheets...
- Set up data integration pipelines with other software
Now I'm hyped, how do I get started?
Welcome to the Amalia Report Creation Guide! This guide will take you on an exciting journey to create, personalize, and make the most of reports in Amalia. Reports let you visualize, share, and even spice up data from the calculation engine – think payments, statements, and more! Plus, you can tap into your directory and upcoming data sources for a complete reporting adventure.
For detailed instructions, please refer to the video:
For a quick summary, follow the steps below:
1️⃣ Creating Your Report 📝
Click on "+New" to start the report creation process. Give your report a catchy name and pick your preferred data source.
Record Metrics: Each record appearing in the dataset of a statement creates a record metric – think of these as individual stories in a book. If a salesperson signs 10 deals and their manager also does due to team effort, you'd have 20 notes in your report. The first 10 records have info from the salesperson's plan, and the next 10 from the manager's.
2️⃣ Want to import data from other data sources?
Click "+Add join". Check out the "Data models and joins" section below for a detailed guide.
3️⃣ Personalising Your Report 🎨
Hit the "+ button" under "Column" to display specific columns. Play around! Drag and drop columns to rearrange them as you like. Column can be renamed or deleted by click on pen icon or dustbin icon respectively. Keep things neat by sorting and grouping data properties in their respectful sections.
4️⃣ Filtering Your Report 🔍
Click on the filter icon. Select "Empty" and click "Edit" next to "No field selected." Choose the property, operator, and enter a comparison value if needed.
5️⃣ CSV Export 🔄
After jazzing up your report, save it using the handy save button. Keep those settings locked in! Check it out – a download icon is now at your service. Click the download icon to download an Excel document with your custom report data.
🥳 Voilà! You're now all set to create smashing reports with Amalia. Happy reporting! 🎉📊
Data models and joins
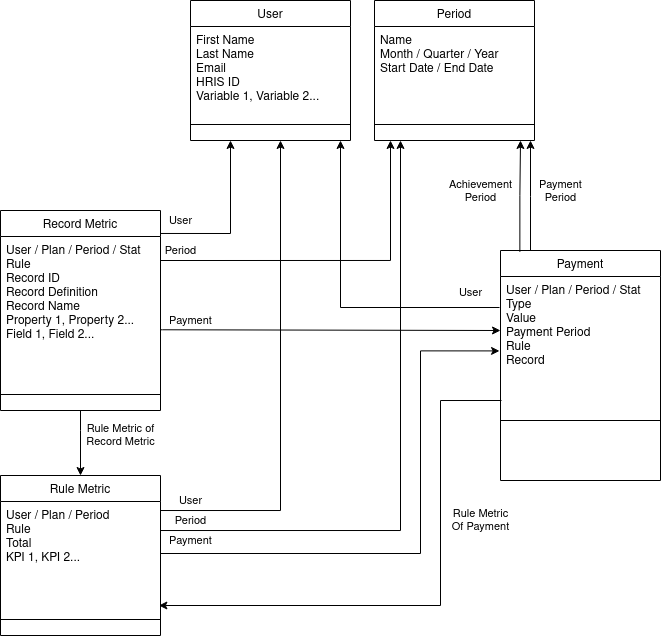
You have the possibility to create a report on those different objects, and link them using the "Configure Joins" modal by following the arrows in this data model.